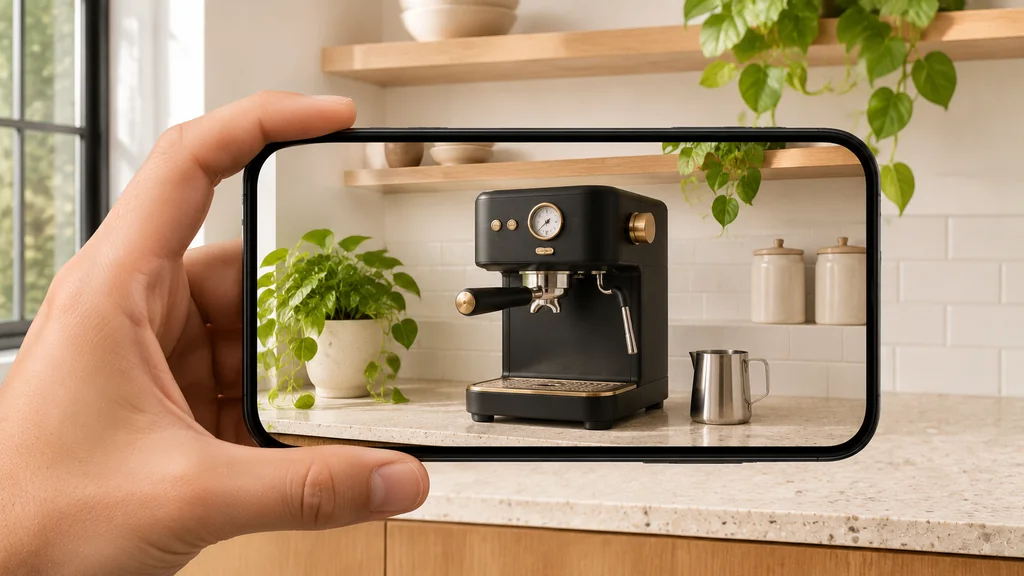
Does interactive 3d product visualization increase conversions? It can—when placed on products where buyers hesitate over physical size, hidden details, or custom finish combinations, and when engineered so it does not slow down mobile page speed. It is not a guaranteed lift on every product, which is why the honest answer is to test it on your own store.
If you are an ecommerce director, brand manager, or store owner deciding whether to invest in 3D and Augmented Reality (AR), you deserve a straight answer—not a recycled marketing pitch.
At 3D Vision Art, we build 3D and AR product assets for a living, and we still tell clients the same thing: never assume a conversion lift—test it cleanly on your own traffic. Here is what published retail research and peer-reviewed studies actually show, why vendor statistics are often misunderstood, when a 3D viewer can accidentally hurt conversions, and how to run an honest A/B test on your store.

What the Published Evidence Actually Shows (With Real Sources)
When you search for conversion data on 3D and AR in ecommerce, you will see the same handful of numbers repeated across hundreds of blogs. The numbers below are reported case-study and platform results, not guarantees: how each one was measured matters as much as the number itself.
| Published Finding | Original Source | What It Actually Measured (The Honest Context) |
|---|---|---|
| 94% higher conversion, on average, for merchants who add 3D content. | Shopify Changelog & Shopify Retail Conversion Guide | Self-reported platform average: Shopify states the figure but does not publish its methodology, sample, or control group. Any comparison between shoppers or products with 3D and those without is exposed to self-selection bias—shoppers who open a 3D viewer already have higher buying intent, and merchants who invest in 3D tend to run more polished stores. Treat it as directional, not as a forecast for your store. |
| 44% more likely to add to cart, 27% more likely to order (3D), and 65% more likely to order (AR) at Rebecca Minkoff. | Shopify AR Guide & Shopify AR Fashion | Observational cohort comparison: Compares Rebecca Minkoff visitors who chose to interact with 3D/AR against visitors who did not interact—showing strong engagement among serious buyers, rather than a blind 50/50 traffic split. |
| 33% conversion rate increase on strollers and up to 21% more time on page at Bumbleride; 40% higher order conversion, 3% higher cart conversion, and 5% fewer returns at Gunner Kennels. | BrainStation / Shopify Report & Shopify Retail Trends | Pre/post merchant rollout metrics: Gunner compared results against its previous quarter, so seasonality and other site changes can't be ruled out. Both brands sell high-consideration, size-sensitive hard goods (strollers and heavy-duty dog crates) where spatial fit is the main purchase blocker. |
| A positive but small overall sales effect from AR, strongest for less popular brands, niche products, more expensive items, and customers new to the online channel or category. | Tan, Chandukala, & Reddy (2022), Journal of Marketing (via Photta Virtual Try-On Audit) | Peer-reviewed academic study: Based on data from an international cosmetics retailer's mobile app, so it measures AR try-on, not 3D product viewers or furniture placement. The authors conclude AR is most effective when product uncertainty is high, which makes it one of the most useful independent references—but it is still one retailer in one category. |
Why the "Interactor vs. Non-Interactor" Comparison Can Mislead You
Suppose 1,000 people visit a product page for a leather armchair:
- 700 visitors glanced at the price, decided it was out of their budget, and closed the tab within five seconds. None of them clicked "View in 3D."
- 300 visitors were seriously shopping for an armchair, loved the price, and clicked "View in 3D" or "View in your space" to check the arm height and leather finish.
If you compare the conversion rate of the 300 people who clicked the 3D viewer against the 700 people who bounced immediately, the 3D group will naturally convert at a vastly higher rate—even if some of those 300 people would have bought the chair from photos alone.
That does not mean interactive 3D is useless. The peer-reviewed Journal of Marketing study above found that AR lifted sales most when product uncertainty was high. For physical products, that uncertainty usually comes down to four questions a shopper cannot answer from flat photos:
- Spatial fit: "Will this 210 cm sofa, dog kennel, or espresso machine fit in my space?"
- Blind-angle inspection: "What sits on the back panel, underneath the base, or inside the lid?"
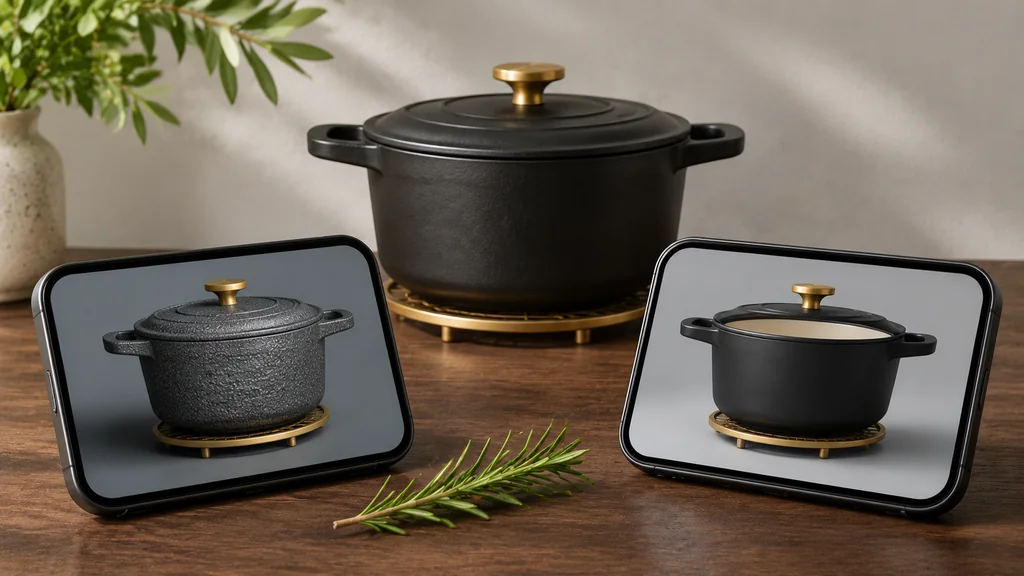
- Tactile material confidence: "Is this metal brushed or mirror-polished? How deep is the leather pebble grain?"
- Variant combination clarity: "How does the walnut base look when paired with the brass hardware?"
When your product has high uncertainty (high price point, complex geometry, unfamiliar brand, or custom options), answering those four questions is where 3D and AR are most likely to lift checkout rates and cut returns—which is exactly what your own test should confirm.
The Hidden Net-Conversion Lever: Fewer Returns
Most store owners calculate conversion rate as Orders ÷ Sessions. Experienced ecommerce operators also look at what this article calls Net Conversion Rate—a working definition, not a standard industry term: orders that actually stay sold after your store's return window closes.
According to the National Retail Federation (NRF) and Happy Returns 2025 Retail Returns Landscape report, retailers expected 19.3% of online sales to be returned in 2025, compared with 15.8% of total retail sales—$849.9 billion in returned merchandise across all U.S. retail channels. Separately, a 2023 Nfinite shopper survey of 1,074 U.S. consumers found that 83% said they would return a product if it didn't match the online image. Both figures are U.S.-wide estimates for 2025 and a 2023 survey respectively—not a predicted return rate for your store or your category.

When an interactive 3D viewer with 1:1 scale-locked WebAR stops a shopper from ordering a piece of furniture or hardware that is 10 cm too wide for their space—and guides them to the size or finish that actually fits—your store avoids the outbound shipping cost, the return shipping fee, and the restocking labor, and keeps a customer who might not have ordered again. Fewer returns only improve the business case if the saving outweighs the cost of producing and maintaining the 3D assets themselves.
When Interactive 3D Can Actually Lower Your Conversion Rate
Here is something that gets less attention than it should: a poorly engineered 3D viewer can reduce your mobile conversion rate.
Why? Because mobile shoppers are impatient, and mobile browsers have strict memory limits:
- Page-speed abandonment: Google's mobile research found that 53% of mobile site visits are abandoned when a page takes longer than 3 seconds to load (cited in 3D Cloud's ecommerce guide), and the Google-commissioned Milliseconds Make Millions study by Deloitte found that a 0.1-second improvement in mobile site speed was associated with 8.4% more retail conversions (summarized in Shopify's retail conversion research). If your developer sets a 25 MB 3D model to auto-download the instant the product page opens—pushing your Google Largest Contentful Paint (LCP) past 4 seconds, which Google rates as "poor"—you can lose more mobile shoppers during loading than the 3D viewer wins back.
- Mobile GPU crashes (
webglcontextlost): If a.glbfile contains uncompressed 4K textures that exhaust an iPhone's graphics memory (MDN WebGL Best Practices), the viewer crashes to a dead black box mid-session. - Inaccurate colors or scale: If a 3D shader makes a matte black product look like shiny grey plastic, or if an AR file is exported at the wrong scale, the 3D view creates more doubt than your 2D photos.
Even a well-built viewer is not free of downsides: the assets cost money to produce, they need updating when the product changes, and integration and testing take time. For inexpensive, familiar products that photos already explain well, good photography may be enough, and 3D may never pay for itself.
We detail the exact engineering rules that prevent these issues in our guides on preparing scale-aware WebAR and 3D assets for retail and building effective 3D configurators and WebAR experiences from CAD to cart.
How to Run an Honest A/B Test on Your Store in 4 Steps
Instead of trusting someone else's case study, run a clean test on 5 to 10 of your own products. Pick products with steady traffic: a smaller store may need several weeks, or a larger product set, before the difference between the two groups is statistically reliable. Decide the sample size and test length before you start, and don't stop early because one good week looks convincing.
- Keep initial page speed identical: Configure your 3D viewer (such as Shopify Native 3D or Google
<model-viewer>) to show a lightweight 2D poster image first and load the compressed.glb(~2–4 MB, a practical starting target rather than a fixed rule) only on user click or gallery swipe. On Shopify, how the native viewer loads depends on your theme, so check that the model only downloads after a tap before you start the test. - Split product page traffic 50/50 at the page level: Use an A/B testing tool (as recommended in Omniconvert's CRO analysis framework) to randomly assign 50% of visitors to Control (2D gallery only) and 50% to Treatment (2D gallery + embedded 3D/AR viewer). Each visitor should stay in the same group for the whole test, rather than being re-assigned on every visit.
- Measure page-wide Revenue Per Visitor (RPV) and Add-to-Cart rate: Compare the entire 50% Treatment group against the entire 50% Control group—not just the subset of users who clicked the 3D button. This measures the effect of offering 3D; how many people actually opened the viewer is a separate, secondary number.
- Track return reason codes for 60 days: Compare "item not as pictured" and "did not fit" returns across the whole Treatment group versus the whole Control group—again, not just the shoppers who opened the 3D viewer. Adjust the tracking period to your own store's return window if it differs from 60 days.
Frequently Asked Questions About Interactive 3D and Conversions
Why do some brands see a big conversion jump from 3D while others see very little?
Conversion lift depends on purchase uncertainty. When shoppers can't judge size, finish, hidden details, or option combinations from photos—as with furniture, strollers, or configurable products—3D and AR answer questions that would otherwise stop the purchase. When a product is inexpensive, familiar, or easy to judge from photos, there is little uncertainty left for 3D to remove, so the lift is usually small.
Does placing the 3D viewer in a separate tab hurt its conversion impact?
Yes. In Baymard Institute's usability research, a third of tested users had trouble when videos and images were split into separate tabs inside the image gallery, and users generally expected videos and 360° views to sit with the main product images. The same logic applies to 3D: place the 3D view directly inside the main product image gallery thumbnails, marked with a clear 3D icon the way a video thumbnail uses a play icon.
How do we make sure our 3D viewer doesn't hurt Google Core Web Vitals?
Use deferred "click-to-load" initialization with a 2D WebP poster image so the 3D engine and .glb buffer never compete with your initial page paint (web.dev Core Web Vitals), and keep the .glb asset optimized around 2 MB to 4 MB as a starting target, adjusted to your product's complexity.
Should we test 3D on mobile and desktop separately?
Yes. AR placement only happens on phones and tablets, mobile devices have tighter memory and bandwidth limits, and Google measures Core Web Vitals separately for mobile and desktop. A 3D viewer that helps on desktop can still slow down your mobile pages, so segment your A/B results by device before deciding where to keep it.
Want Conversion-Ready 3D and AR Assets Built to Test on Your Store?
If you want this done for your products—starting with a focused pilot of 5 to 10 SKUs engineered for fast mobile loading, accurate Khronos PBR Neutral colors, and verified 1:1 AR scale so you can measure the real impact on your own traffic—explore our 3D & AR Assets for Ecommerce services. Every .glb and .usdz asset is validated before delivery, so your test measures true product appeal, not technical glitches.
Tell us which products you want to test first.
Get a Free Quote ↗