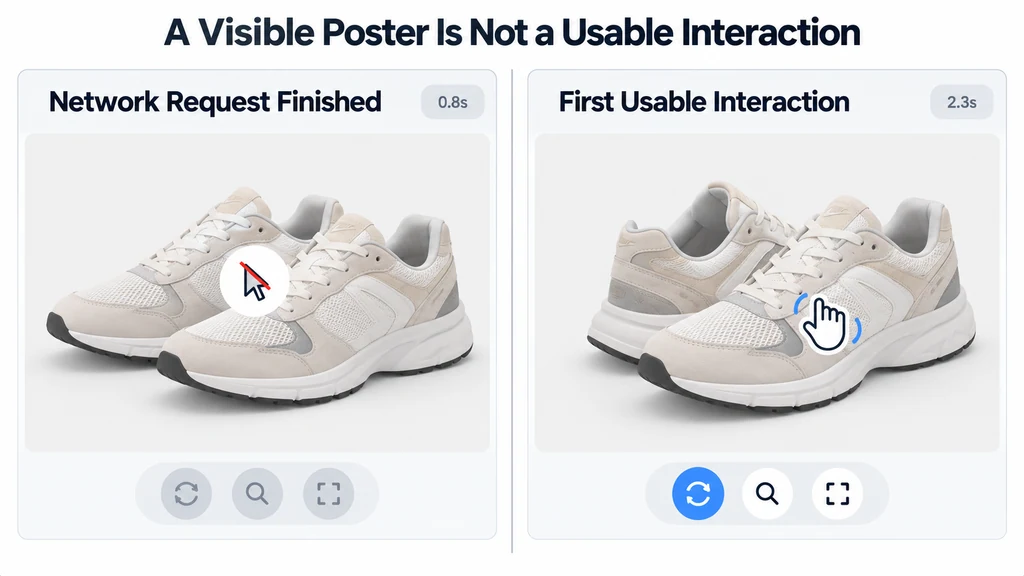
Define a usable state for the particular viewer. It might require the default model, the correct finish, functioning controls, and a responsive first rotation. Write that definition before collecting timings.
Define observable milestones
Place named timestamps around events the application can actually observe. Performance.mark supports named marks on the browser performance timeline.
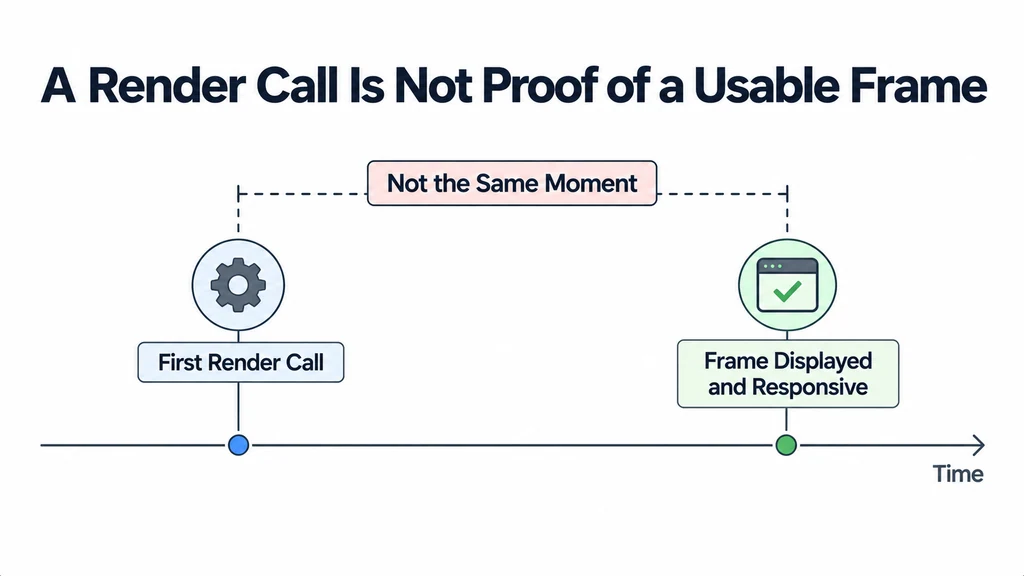
Useful boundaries include user intent, request start, loader completion, first scheduled render after asset attachment, and controls enabled. Distinguish the first render call from proof that a frame has been displayed and is responsive.
Record errors and cancellations as outcomes. Excluding failed loads can make the successful sample look better while hiding the user's actual experience.
Avoid naming a broad interval after one hidden stage
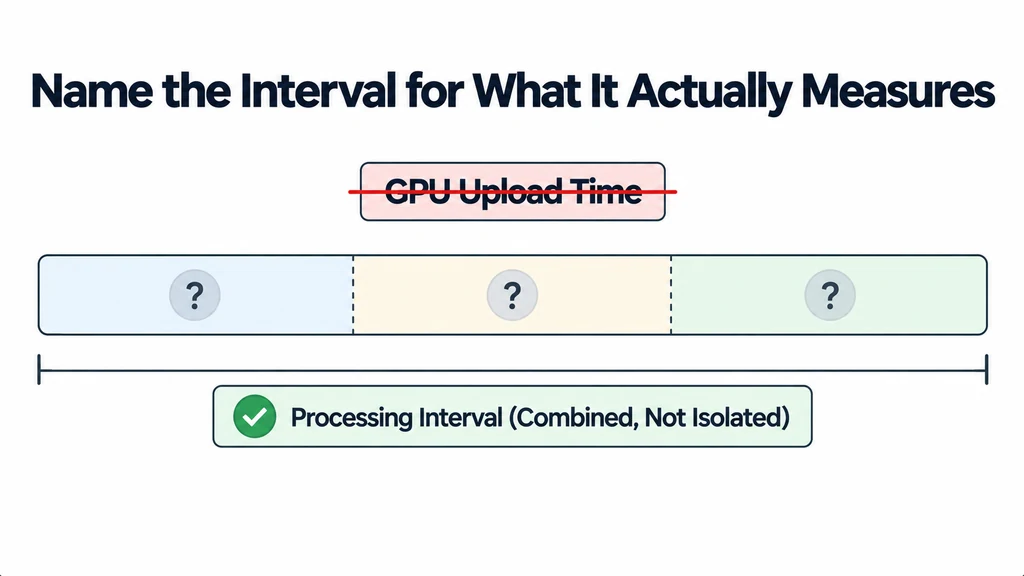
A loader-completion interval can contain several kinds of work. Do not label it "GPU upload time" unless the measurement isolates that operation.
Use a browser trace to investigate unexplained gaps and relate application marks to the trace. Consult the renderer documentation for the operations used by the application, but do not infer exact stage timing from a generic callback.
If the instrumentation cannot separate decoding from parsing, report a combined processing interval. Honest boundaries are more useful than precise-looking labels with uncertain meanings.
Run controlled cache conditions
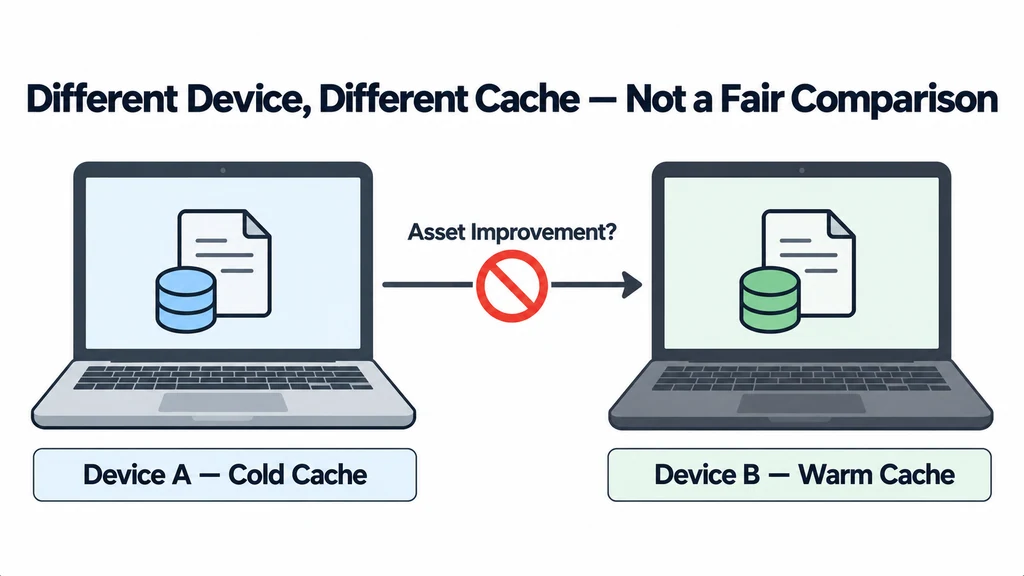
Test cold and warm cases separately. The HTTP caching guide explains why repeated requests may follow different paths.
Record the device, browser version, viewport, network conditions, asset revision, and cache preparation. Repeat the same interaction sequence. Do not compare a first visit on one device with a cached visit on another and call the difference an asset improvement.
Include the real page when making a product-page claim. Fonts, other media, scripts, and layout can affect the experience beyond an isolated viewer demo.
Give each timing record an honest name
Use a unique attempt ID when making marks so overlapping loads cannot share endpoints. Record the asset revision, cache condition, success or failure, and the observed intervals together.
const prefix = 'viewer-attempt-17';
performance.mark(prefix + ':intent');
// Start the application's actual load operation here.

// In the current attempt's successful loader callback:
performance.mark(prefix + ':loader-complete');
performance.measure(
  prefix + ':intent-to-loader',
  prefix + ':intent',
  prefix + ':loader-complete'
);
This measures a combined application interval. It does not isolate network, parsing, GPU upload, or the moment a frame reaches the display. Add readiness and interaction records at the application's real boundaries, and use a browser trace when investigating hidden work. A requestAnimationFrame callback or a render call alone is not proof of display presentation.
Report cold and warm samples separately with their preparation method. Keep failed and cancelled attempts in the outcome record rather than quietly dropping them from the experience report.
Verify the end condition
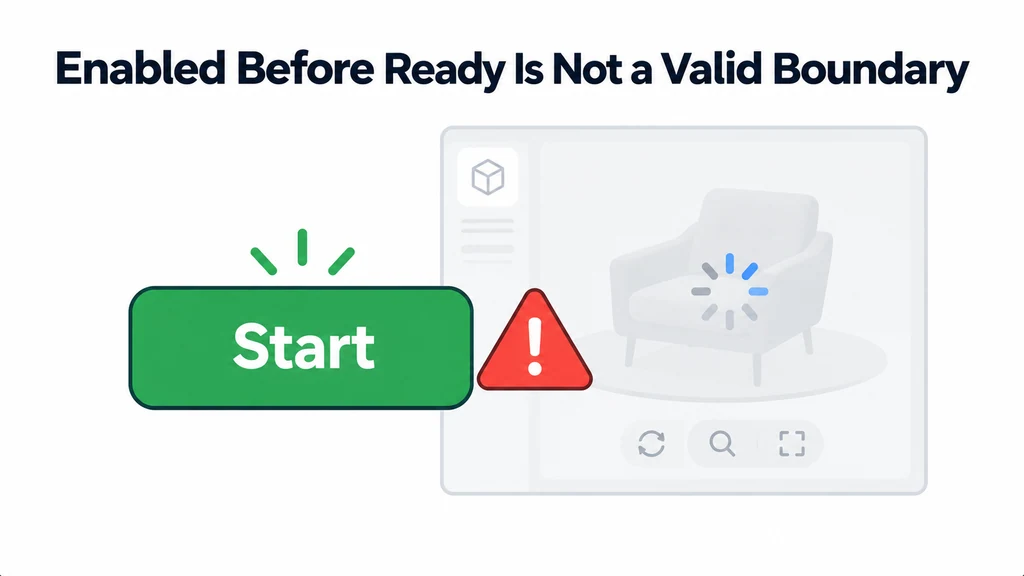
After the readiness mark, perform a defined interaction. Confirm that the model responds and that the selected finish is correct. A button becoming enabled before the asset is ready is not a valid success boundary.
Inspect several runs rather than quoting the fastest. Report the collection method and the observed spread with any summary statistic. Keep the raw records so an unusual run can be investigated.
Change one suspected cause, then repeat the same protocol. A useful report identifies which interval improved and whether interaction quality stayed intact. It does not reduce the entire loading experience to the model's download size.